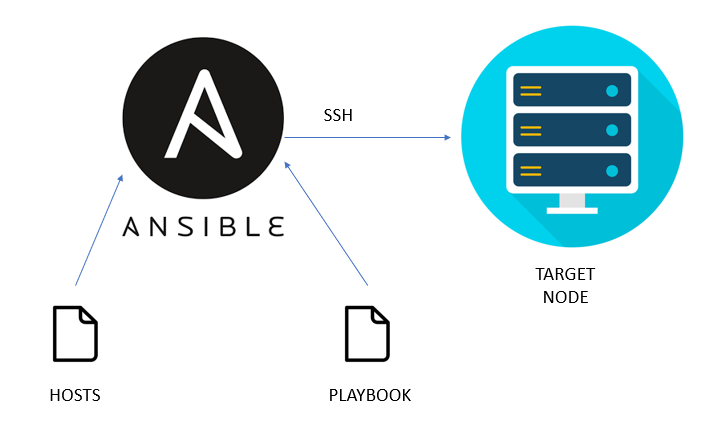
Monitoring Solution using a TimeSeries Database exporting Infra Metrics (Part 1)

Here, I will be creating a monitoring solution using tools like Fluent-bit , Apache Kafka, Telegraf and InfluxDB . The Infra metrics (CPU, Memory and Disk) of server will collected by Fluent-bit and will be pushed into Apache Kafka topic and Telegraf will collect those data from Apache Kafka and push to InfluxDB . As InfluxDB is push-based database , It cannot collect the data directly.
Tools Used :
Fluent-bit : It is a super-fast, lightweight, and highly scalable logging and metrics processor and forwarder. It is sending system metrics to Kafka.
Kafka : It is used to build real-time streaming data pipelines and real-time streaming applications. It is collecting fluent-bit(producer) metrics data in topics and sending to InfluxDB(consumer).
Telegraf : It is a plugin-driven server agent for collecting and sending metrics and events from databases, systems, and IoT sensors.
Its purpose is to collect data from the given data sources and push it to InfluxDB.
InfluxDB : It is used for storage and retrieval of time series data in fields such as operations monitoring, application metrics, Internet of Things sensor data, and real-time analytics. InfluxDB is a push-based database which means it can’t collect your data and you need to push to it.
High Level Architecture View

This is the high-level architecture view of the monitoring solution we have made.
We have deployed fluent bit in our one of our VM’s as it is very light weighted and highly scalable, it is collecting the system metrics data like CPU, Disk and Memory and by minimal processing it then uses the forward protocol to send data to fluent bit which is acting as an aggregator where it is performing filtering and processing before routing it to the kafka topics. Then Kafka which is a real-time streaming messaging queue is processing and storing high volumes of metrics data into topics. Then we are using telegraf which is a plugin-driven server agent, which is collecting and sending the metrics data from Kafka topics to InfluxDB which is a Time Series Database, and since it is a push-based database so it can’t collect data from Kafka topics directly, so Telegraf is the medium through which InfluxDB fetches data.
And to get interactive visualizations of metrics data we are using Grafana.
Why Fluent Bit ??
1.Compatible with 80+ plugins for Inputs, Analytics Tools and Output
2.Compatible with SQL Stream Processing (Aggregation, Grouping …etc)
3.Lightweight, asynchronous design optimizes resource usage: CPU, memory, disk I/O, network.
4.Granular management of data parsing and routing. Filtering and enrichment to optimize security and minimize cost. Uses tags and matching for Data Source for flexible routing
5.Fluent Bit Enables You To Collect Logs And Metrics From Multiple Sources, Enrich Them With Filters, And Distribute Them To Any Defined Destination.
6.Zero Dependencies, High Performance at Low Cost, High Scale with low resources and preferred for containerized environments.
7.Built in Security, has TLS connection and send logs safely to backends.
How Does Fluent Bit Works ?

Input: Gather Information from different resources (E.g.:- Pods Info from K8S, CPU , Memory , Disk Info from Linux System).
Parser: Convert Unstructured to structured data
Filter: Modify your records and enrich your records and drop records if not required.
After processing data, it routes data to different storage backends (output plugins). Fluent Bit can take multiple input sources and send them to multiple output destinations.

Fluent Bit vs. Fluentd

Installation of Fluent Bit
Manual Download (Ubuntu): (Method 1)
This will always install the most recent version released.
1. curl https://raw.githubusercontent.com/fluent/fluent-bit/master/install.sh | sh
2. sudo apt-get update
3. sudo apt-get install fluent-bit
4. sudo service fluent-bit start
5. sudo service fluent-bit status
Note: — The default configuration of fluent-bit is collecting metrics of CPU usage and sending the records to the standard output, you can see the outgoing data in your /var/log/syslog file.
Docker (Method 2):
1. Install docker
Download the last stable image from 1.9 series:
2. docker pull cr.fluentbit.io/fluent/fluent-bit:1.9.2
Once the image is in place now run , which makes Fluent Bit measure CPU usage by the container:
3. docker run -ti cr.fluentbit.io/fluent/fluent-bit:1.9.2 -i cpu -o stdout -f 1
That command will let Fluent Bit measure CPU usage every second and flush the results to the standard output, e.g:
[2019/10/01 12:29:02] [ info] [engine] started
[0] cpu.0: [1504290543.000487750, {“cpu_p”=>0.750000, “user_p”=>0.250000, “system_p”=>0.500000, “cpu0.p_cpu”=>0.000000, “cpu0.p_user”=>0.000000, “cpu0.p_system”=>0.000000, “cpu1.p_cpu”=>1.000000, “cpu1.p_user”=>0.000000, “cpu1.p_system”=>1.000000, “cpu2.p_cpu”=>1.000000, “cpu2.p_user”=>1.000000, “cpu2.p_system”=>0.000000, “cpu3.p_cpu”=>0.000000, “cpu3.p_user”=>0.000000, “cpu3.p_system”=>0.000000}]
Docker Compose (Method 3) :

version : “3” — → Version of docker-compose
services → Instructs Docker compose what follows will be the services to deploy
image — → Instruct Docker Compose to deploy a container using the official fluent-bit I image
port — — → External and internal ports to use for the fluent-bit
$ docker-compose -f fluent-bit.yaml. up — -> To start the containers

You can also see the logs ( stdout parameter)
Check the containers which are running using the below command:
$ docker ps

Fluent Bit Configuration in Docker-Compose File
Step 1: Create a updated fluent-bit.conf file ( Add metrics that you want to monitor in a system like disk , cpu and memory in INPUT section )
[SERVICE]
Flush 5
Daemon Off
Log_Level info
Parsers_File parsers.conf
Plugins_File plugins.conf
HTTP_Server Off
HTTP_Listen 0.0.0.0
HTTP_Port 2020
[INPUT]
Name cpu
Tag cpu.local
Interval_Sec 1
[INPUT]
Name disk
Tag disk
Interval_Sec 1
Interval_NSec 0
[INPUT]
Name mem
Tag memory
[OUTPUT]
Name stdout
Match *
Step 2: Update your docker-compose yaml file to add a volume parameter, which copies the updated fluent-bit.conf file to the container’s(fluent-bit) configuration file path

$ docker-compose -f fluent-bit.yaml up -d
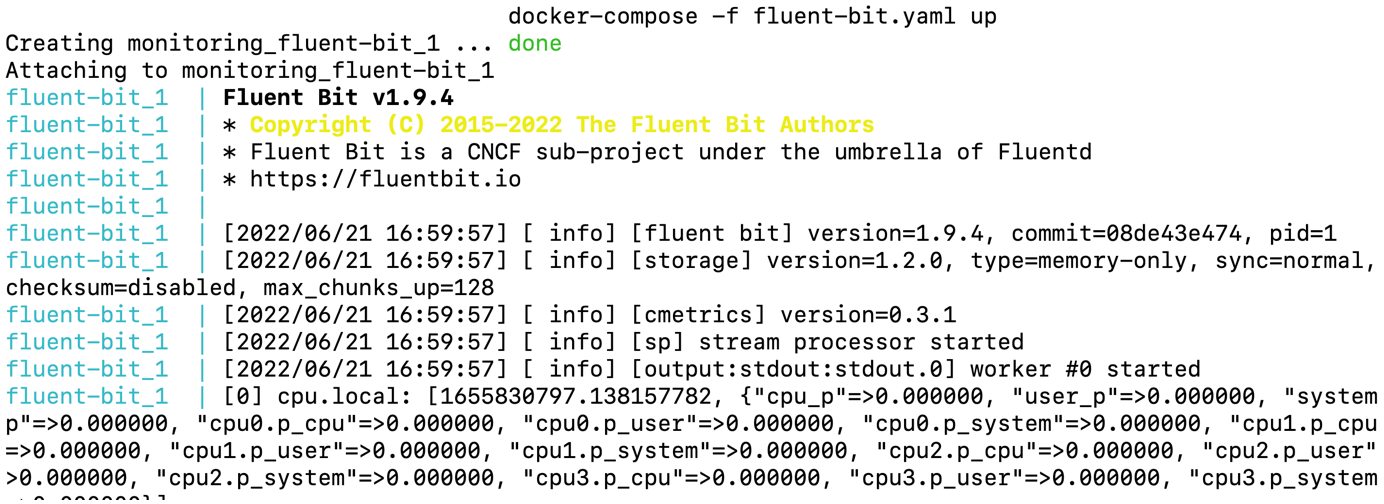
We can see Cpu, Memory and Disk metrics of the system are getting reflected

Fluent Bit Configuration
configuration file of fluent bit: /etc/fluent-bit/fluent-bit.conf
There are four types of sections that can be defined: service, input, filter and output:
· Service — It defines global configuration settings such as the logging verbosity level, the path of a parsers file (used for filtering and parsing data), and more.
· Input — It defines the input source for data collected by Fluent Bit and will include the name of the input plugin to use.
· Filter — It defines which filter plugin to use for filtering the data.
· Output — It defines the output destination for the data and will include the name of the output plugin to use.


Comments
Post a Comment